The Web version consists of two major sections: “User Input” and “Results” that are visible to the user and each of these two sections are connected to one another through “Reference Data Pool” and “Processes and Calculations” that provide the necessary data and calculations at the background and these two sections are not visible in the Web tool but in the Excel version (See Figure 1). In addition to the “Reference Data Pool” pages in Excel version, each “Process and Calculation” section accommodates smaller databases from exhaustive literature including ([EPA] 1994; CEMBUREAU 1999a; CEMBUREAU 1999b; Worrell, Martin et al. 2000; Worrell, Price et al. 2001; [USDOE] 2003; Bhatty, Miller et al. 2004; [CSI] 2005; [EFCA] 2006; Marceau, Nisbet et al. 2006; Alsop 2007; Facanha and Horvath 2007; Marceau, Nisbet et al. 2007; [APP] 2008; [LBNL] 2008; Worrell and Galitsky 2008; [IPPC] 2009; Boesch, Koehler et al. 2009; Boesch and Hellweg 2010; [NREL] 2011; [EIA] 2011a; [EIA] 2011b; [EPA] 2012; [NREL] 2012).
The “Reference Data Pool” worksheets consist of life-cycle inventories of electricity generation grid mix, freight transportation, and fuel pre-combustion and combustion based on the database from current studies. Life-cycle inventories of electricity, fuel, and materials are organized for each materials production phase in “Process and Calculation” worksheets within the Excel tool. Emission factors from the “Reference Data Pool” worksheets are multiplied by the phase inventories to calculate the total phase impacts. These emission inventories are summed and collected in the “Results” page together. Figure 3 illustrates the GreenConcrete LCA tool structure briefly.
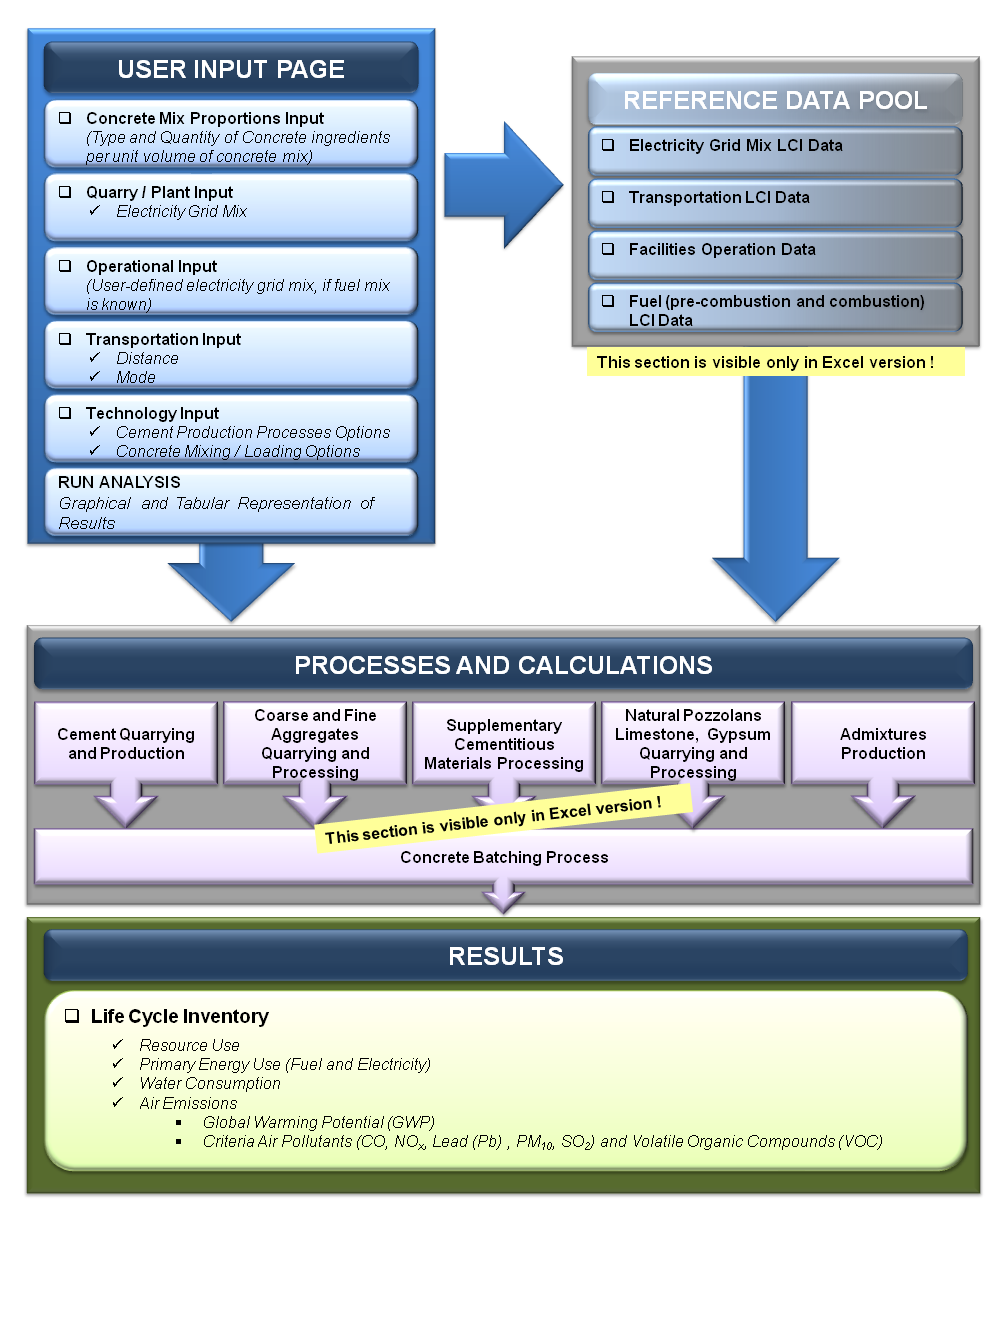
Figure 3 GreenConcrete LCA tool structure
The user-input page provides necessary information to the remaining worksheets of the tool it consists of color-shaded and drop-down cells with input data entered or selected by the user.
There are seven sections on this page:
Table 1 User Input Page – Electricity grid mix input (by % energy) for user defined options (US average % values are demonstrated for comparison purposes)
| Type of Electricity Source | User-defined grid mix (%) |
US average (default) (%) |
| Bituminous Coal | User Input | 44.4% |
| Natural Gas | User Input | 23.3% |
| Residual(Heavy) Oil | User Input | 0.5% |
| Distillate (Diesel/Light) Fuel Oil | User Input | 0.2% |
| Petroleum Coke | User Input | 0.4% |
| Nuclear (Uranium) | User Input | 20.2% |
| Hydro | User Input | 6.9% |
| Biomass | User Input | 1.4% |
| Geothermal | User Input | 0.4% |
| Solar | User Input | 0.0% |
| Wind | User Input | 1.9% |
| Lignite Coal | User Input | 0.0% |
| User Input Page – Destinations for Transportation Input |
|
Table 2 User Input Page - Technology Drop-down Options by Cement Production Phases
| Cement Production Phases | Product of Each Phase | Technology Options |
| Raw Materials Prehomogenization | Raw Meal | Dry process Raw storing, non-preblending Dry process Raw storing, preblending Wet process Raw storing |
| Raw Materials Grinding | Ground Meal | Dry raw grinding ball mill Dry raw grinding tube mill Dry raw grinding vertical roller mill Wet raw grinding tube mill Wet raw grinding wash mill |
| Raw Meal Blending/ Homogenization | Blended Meal | Raw meal homogenization, blending, and storage Slurry blending homogenization and storage |
| Pyroprocessing | Clinker | Wet kiln Long dry kiln Preheater kiln Preheater/Precalciner kiln U.S. Average kiln |
| Clinker Cooling | Cooled Clinker | Rotary (Tube) Cooler Planetary (Satellite) Cooler Reciprocating Grate Cooler (Conventional) Reciprocating Grate Cooler (Modern) Vertical Gravity Cooler with Planetary Cooler Grate Cooler (Recirculating Excess Air) PM Control Technology Options: Fabric Filter (FF) Electrostatic Precipitators (ESP) |
| Finish Milling, Grinding, and Blending with Portland Cement | Blended Cement or Traditional Portland Cement | Tube Mill Vertical Roller Mill Ball Mill Roller Press Horizontal Roller Mill (Horomill) |
In addition to the production process technology inputs, pyroprocessing phase requires user input of major kiln fuels (by percent kiln energy requirement). In case the user does not know the kiln fuel percentages, he/she can still perform the calculations by selecting the default U.S. average values provided by Portland Cement Association ([PCA] 2006). Data from this section feeds into “Pyroprocessing” tab to estimate energy use and emissions for the preparation of six types of traditional fuels and nine types of waste fuels for kiln use. Additionally, input from this section is used to calculate pyroprocessing-related pre-combustion and combustion impacts for four different kiln technology options and one U.S. average kiln option. Below, Table 3 tabulates kiln fuel options and default energy percentages (corresponding to the fuel options) for US average case.
Table 3 User Input Page - Cement Pyroprocessing Fuel Use Options
| Fuel Options | Percent by Energy | US Average Fuel Percent (based on Economic Research Survey by [PCA] 2006) |
| Bituminous Coal | User Input | 64.1% |
| Lignite Coal | User Input | 0.0% |
| Distillate (Diesel/Light) Fuel Oil | User Input | 0.8% |
| Residual(Heavy) Oil | User Input | 0.2% |
| Petroleum Coke | User Input | 21.2% |
| Natural Gas | User Input | 3.7% |
| Waste Oil | User Input | 0.3% |
| Waste Solvent | User Input | 4.0% |
| Waste Tire (whole) | User Input | 1.8% |
| Waste Tire (shredded) | User Input | 1.8% |
| Waste (Other) (non-hazardous) | User Input | 2.3% |
| Waste Paper, cardboard | User Input | 0.0% |
| Waste Plastics | User Input | 0.0% |
| Waste Sewage sludge (dry) | User Input | 0.0% |
| Waste (Other) (hazardous) | User Input | 0.0% |
During the production of cement, process input and output materials (e.g. raw meal, ground meal, clinker, etc.) are transferred from one process station (e.g. pyroprocessing) to the next one (e.g. finish milling) and this can be accomplished by various conveying technologies. In addition to the conveyance distance input, the user is asked to select among four different conveying technology options that are commonly used in cement plants.
| User Input Page – Options for Conveyance Technology within Cement Production Plant |
|
Major technological variations in concrete batching plant are captured by two technology variables, namely, PM control technology options (same as cement plant dust control options which are fabric filter and ESP) and loading/mixing technology options (either mixer loading or truck loading). User can select the concrete batching technology option from the drop-down lists provided.
In case of lack of input data, the user has option to proceed with the default values defined in the tool and can still run the analysis successfully.
_____________________________________________________________________________________________________________________________________
For further information contact Petek Gursel at pgursel[at]berkeley.edu
HTML and Javascript Coding by Claudine Custodio